Today’s blog comes to us from Annie Jenson, Thinking Nation’s Director of Curriculum, who has been hard at work this summer creating a variety of resources for our teachers:
We’ve all heard some iteration of this quote by Mark Twain, “Facts are stubborn little things, but statistics are pliable.” And in an era where stats and data are so easily accessible and then disseminated, the role of the historian and educator has become even more integral to a functioning democratic society.
Our mission at Thinking Nation may be simple – “To cultivate thinking citizens” – but our work is complex. Part of developing critical thinking skills in students must include education and practice in analyzing data.
Over the summer, we have created a tool to help teachers do just that. We are calling it our “Quantitative Analysis Formative Assessment.”
Our newest resource is a 15-30 minute activity in which students are first exposed to data. After a brief analysis, students evaluate the accuracy of conclusions based on the information provided in the data. To conclude, students justify their answer.
We utilize “Weighted Multiple Choice” (WMC) in this assessment in which there is only one incorrect answer and the other options are ranked. As described by historian Bruce Vansledright, WMCs allow us to “retain some scoring efficiencies while assessing much more complex ideas and interpretations. These items also do improved justice to the [history] domain’s complexity…”
The inclusion of WMCs in the classroom not only does “justice to the domain’s complexity” it also fuels increased classroom discussion. As answers are correct to a differing degree and students must justify their answer, there is ample opportunity for debate. Rather than a student feeling embarrassed from choosing an incorrect answer, they feel motivated to defend their choice.
In these discussions, we have witnessed democracy in action. Students make claims, use evidence to support their reasoning, and provide counterarguments to the assessments of their peers. And this is how students become both empowered and capable of engaging in meaningful dialogue outside of the four walls of a classroom.
There are so many ways to misinterpret data. From considering the collection of data, to analyzing whether the data is sufficiently representative, to generalizing information, it is no wonder that the exact same graph can yield wildly different conclusions.
In our Quantitative Analysis Formative Assessment, students are exposed to both accurate conclusions and data misunderstandings. Through this practice, they will become more attuned to the critical way in which statistical information should be evaluated.
The most polarizing conversations in our nation lately have been political in nature. And there are abundant recent examples of both the misinterpretation and misuse of political data presented. Thus, we especially focused on creating Quantitative Analysis Formative Assessments for students in an American Government course.
In one of our formative assessments (Linked here!), students have the opportunity to consider the balance between civil liberties and national security. The graphs depict American attitudes from 2004 to 2015 on how the government has handled terrorism.
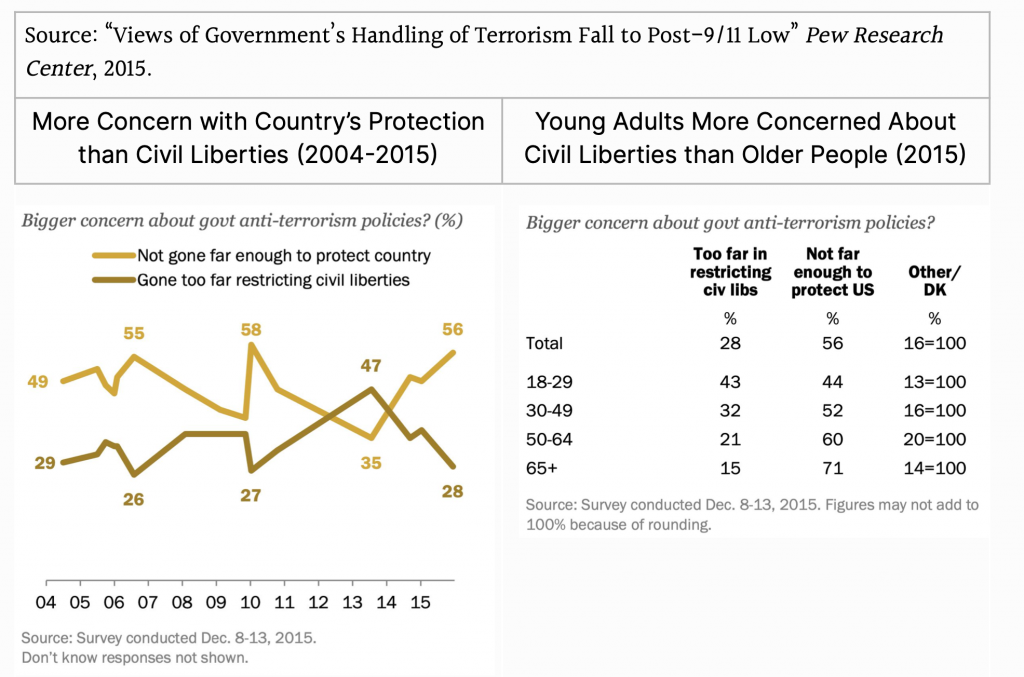
In our WMC, one conclusion states, “Age is the only factor that impacts one’s opinion on U.S. efforts to protect civil liberties.” This is a classic example of misinterpretation. Just because age is the only factor represented, it does not mean that it is the only factor involved. For students who choose this answer, they would receive “0” points, however, the weight of the lesson learned is immeasurable. These students will be much more critical in the future as they consider what data is represented and what data is not included.
We are excited about this new offering to our partner schools as we are continually seeking ways to support the efforts of cultivating thinking citizens!